Understand the world around you. Discover the story of your building.
ICI connects Earth’s changing environment, the science of space, and the buildings and communities we depend on. Free, with no account needed.Earth, space and the buildings and communities we depend on, connected and sourced. Free, no account needed.
Free public information. Every figure names its source.
Earth imagery and data: NASA and NOAA. Moon surface: NASA SVS (LRO); phase calculated. Sunlight calculated for the current time.About this Earth, Moon and sky view
Surface: NASA Blue Marble: Next Generation, a cloud-free composite of 2004 satellite imagery (NASA Earth Observatory, via NASA GIBS). It shows no current weather or clouds.
City lights: NASA Black Marble 2016 (Suomi NPP VIIRS), via NASA GIBS. An annual composite, not tonight’s lights.
Day and night: the Sun’s position calculated for the simulated time shown.
Rotation: time-compressed.
Wind: NOAA Global Forecast System model analysis, 10 m above ground. One model time, not live and not an observation.
Aurora: NOAA Space Weather Prediction Center OVATION model. A model estimate, not an observation.
Moon and Sun: calculated directions; the Moon’s distance is shortened to fit the frame.
Moon: phase calculated for the current time.
Moon surface: NASA’s Scientific Visualization Studio, CGI Moon Kit colour map (svs.gsfc.nasa.gov/4720), made from the Lunar Reconnaissance Orbiter Wide Angle Camera mosaic, with LOLA laser-altimeter albedo filling the polar gaps. Public domain; adjusted by NASA for natural appearance, not for science. The surface is a fixed map, not a current photograph or a live camera; only its phase, lighting and orientation are calculated.
NASA and NOAA imagery and data are public. Their use here does not imply endorsement by NASA or NOAA.
Discover what’s happening around our world
Latest official updates first.
EarthAcross Canada and the United States
How do space, Earth and weather affect the buildings we depend on?
Two connected experiences, each with its sources. The Earth Almanac shows weather, water, land and environmental history around the planet. The Space Almanac follows the Sun, Moon, planets and stars for any place and date.
Start with a postal code or ZIP to see the storms, hail, wind and floods recorded near the area. Add what you know about the building and its equipment. You get a dated profile of what is known, what is missing and what to look at next. Free, with no account.
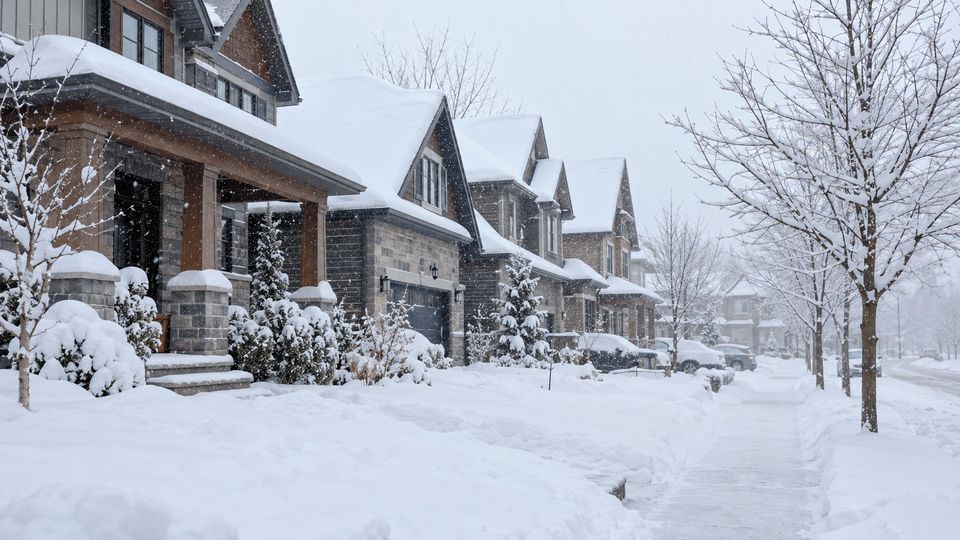
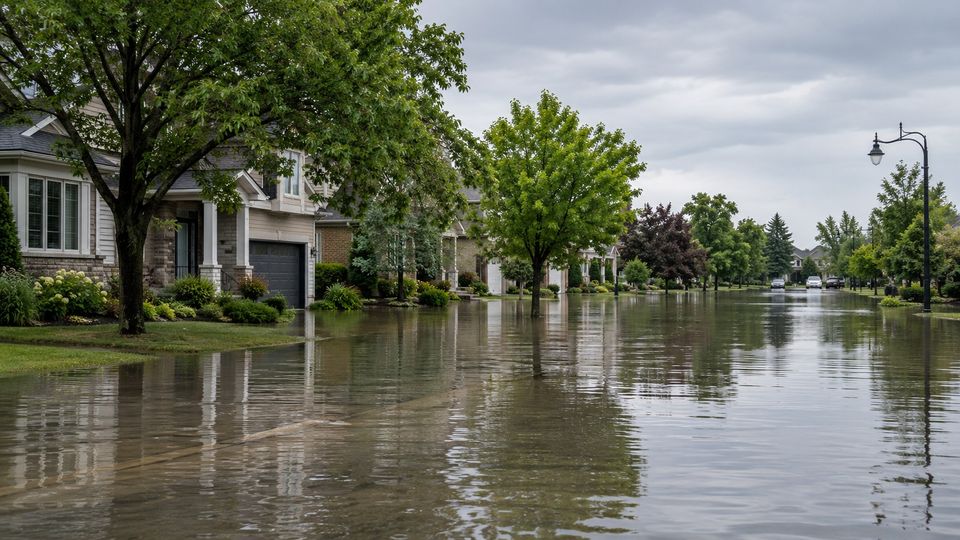
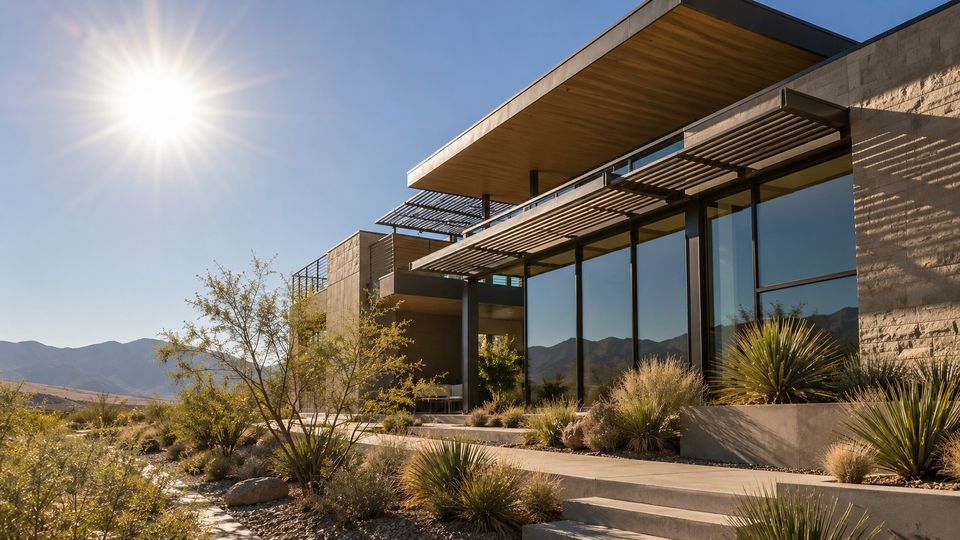
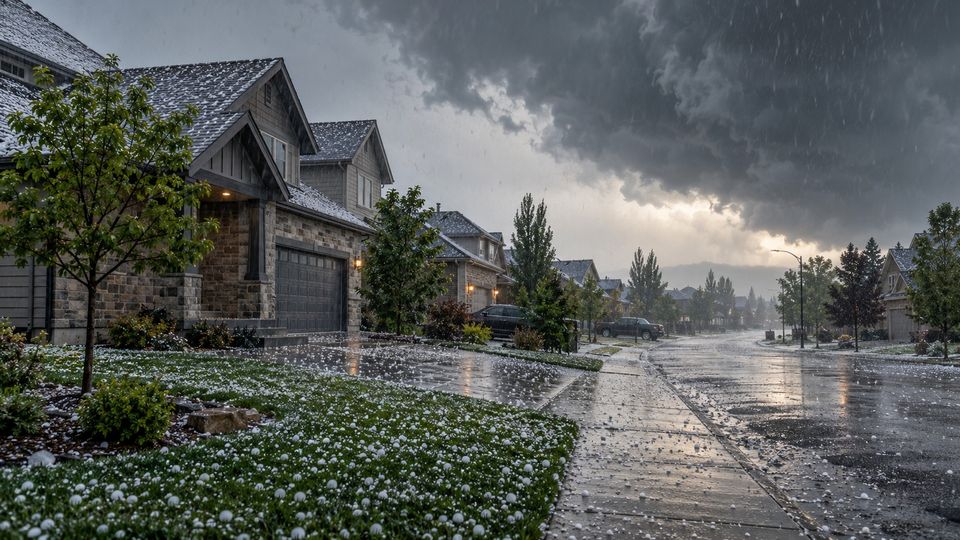
Photographs show each kind of weather in general. They do not show a particular building or event.
Early access
Know when the weather could affect your building.
Building Alerts will email you when an official weather warning is issued for the area you choose, with simple steps to protect your building. Building Alerts is in early access. It is not operating yet and no alerts are being sent.
Thirty years of climate records show what a place really lives with. Here are six examples, from more than 7,500 weather stations across every province, territory and state: how hard winters and hot summers compare.
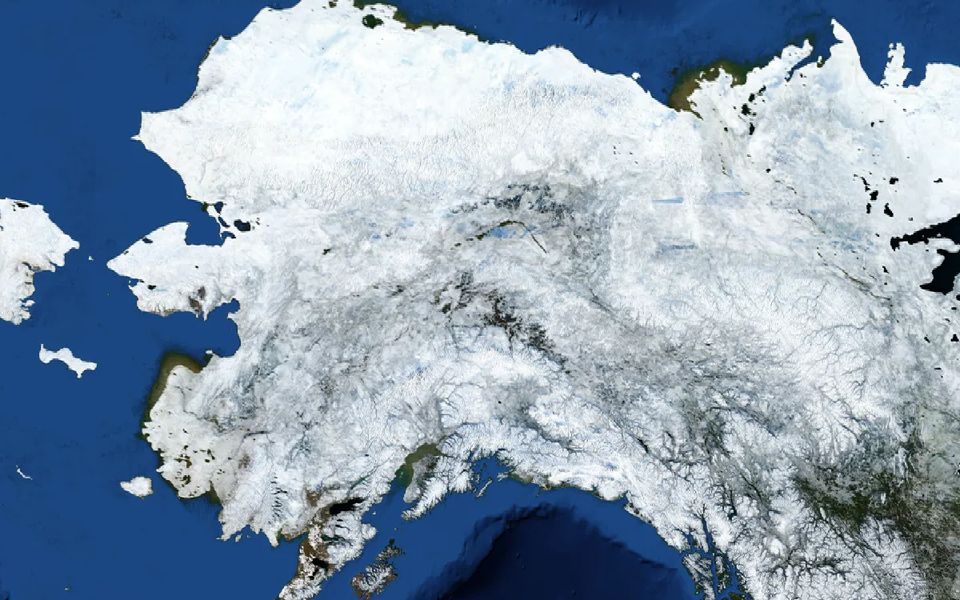
Fairbanks Alaska
Days a year at or below 0 °F
106
Days a year at or above 90 °F
0.3
Aurora station, 4 km away. NOAA.
High heating demand: a long, cold heating season, so reliable heat, freeze protection and insulation matter most. Aurora station: about 13,314 heating degree days (°F, base 65 °F) in a typical year, 1991–2020 normals.
Heavy annual snowfall: plan roofs, drainage and clearances for snow and meltwater. Fairbanks International Airport station: about 64.6 inches of snow in a typical year, 1991–2020 normals.
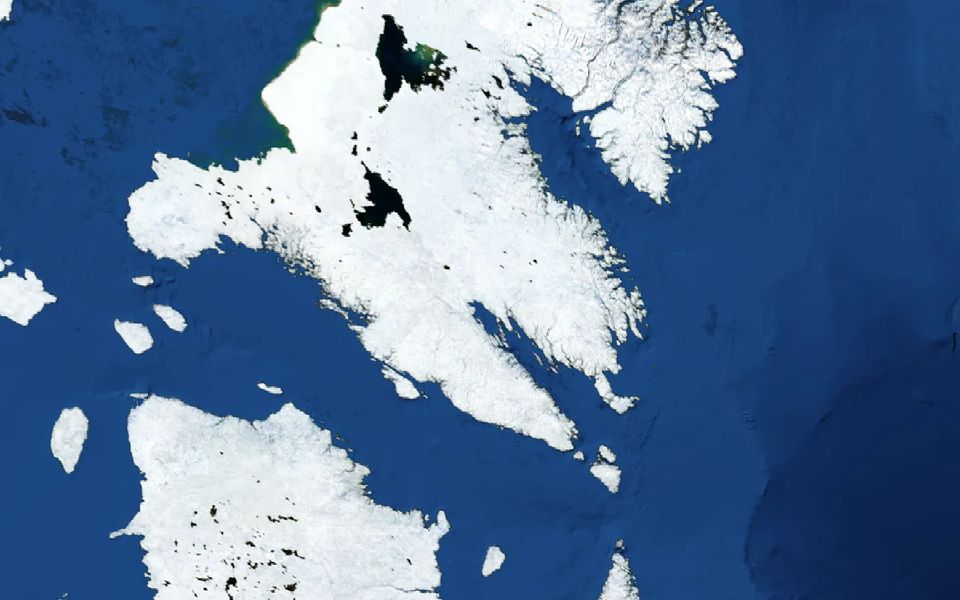
Iqaluit station, 2 km away. Environment and Climate Change Canada.
High heating demand: a long, cold heating season, so reliable heat, freeze protection and insulation matter most. Iqaluit station: about 9,642 heating degree days (°C, base 18 °C) in a typical year, 1991–2020 normals.
Heavy annual snowfall: plan roofs, drainage and clearances for snow and meltwater. Iqaluit station: about 190 cm of snow in a typical year, 1991–2020 normals.
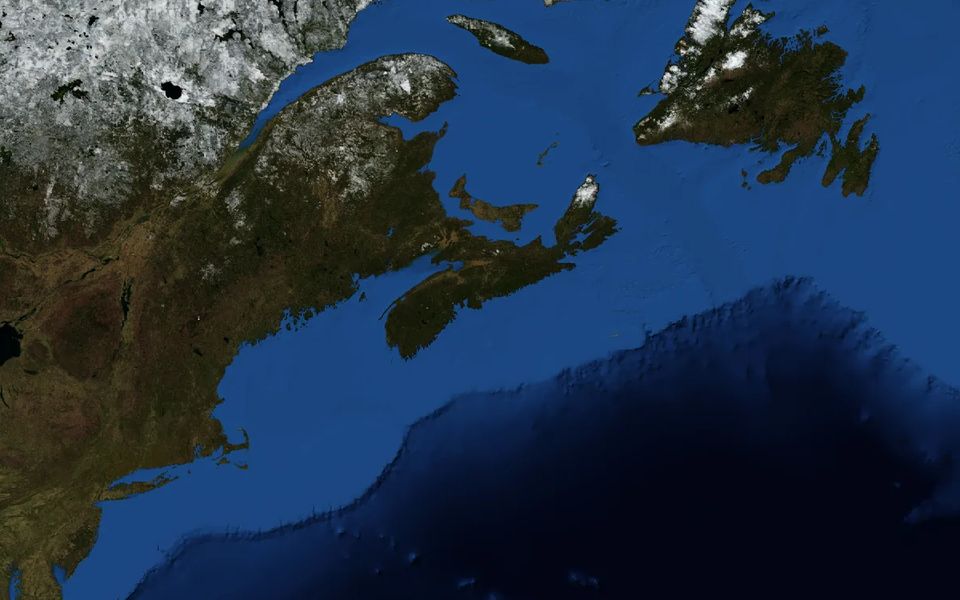
Shearwater station, 7 km away. Environment and Climate Change Canada.
Floods are on record nearby: clear drains and a tested sump are worth having. Natural Resources Canada records 108 flood events within 25 km (history, not a prediction).
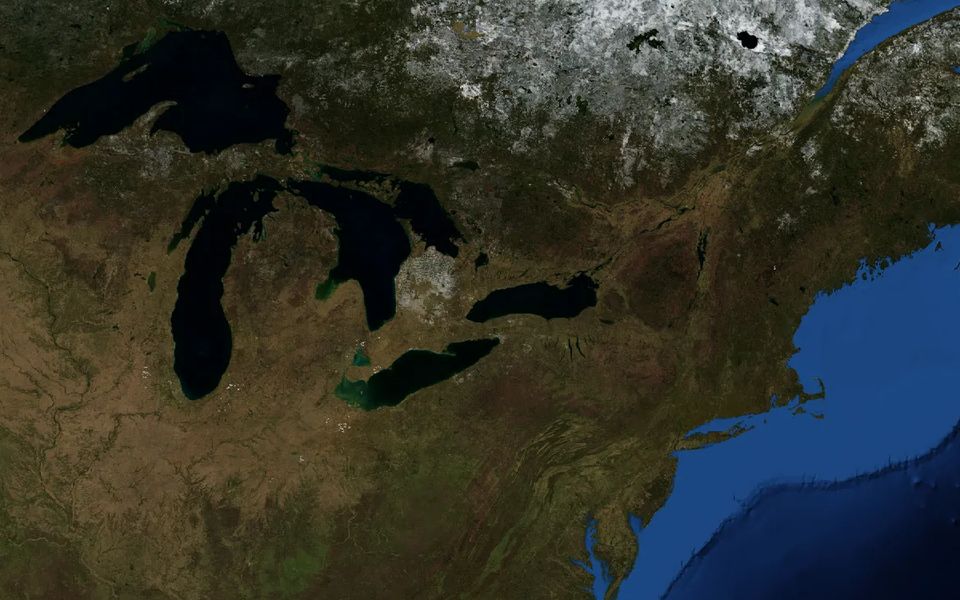
Toronto (Island) station, 1 km away. Environment and Climate Change Canada.
Both heating and cooling demand are significant here, so equipment is tested in winter and summer. Toronto (Island) station: about 3,667 heating degree days (°C, base 18 °C) and 266 cooling degree days (°C, base 18 °C) in a typical year, 1991–2020 normals.
Floods are on record nearby: clear drains and a tested sump are worth having. Natural Resources Canada records 22 flood events within 25 km (history, not a prediction).
High cooling demand: cooling equipment and the power supply carry a large summer load. Phoenix Sky Harbor International Airport station: about 4,765 cooling degree days (°F, base 65 °F) in a typical year, 1991–2020 normals.
High cooling demand: cooling equipment and the power supply carry a large summer load. Terrytown station: about 3,150 cooling degree days (°F, base 65 °F) in a typical year, 1991–2020 normals.
Frequent heavy-rain days test roof drains, grading and spaces below ground. New Orleans Audubon station: about 20.6 days with an inch or more of rain in a typical year, 1991–2020 normals.
Climate Normals 1991–2020, measured at the nearest suitable station. Distances are from the centre of each postal area, ZIP code or community.
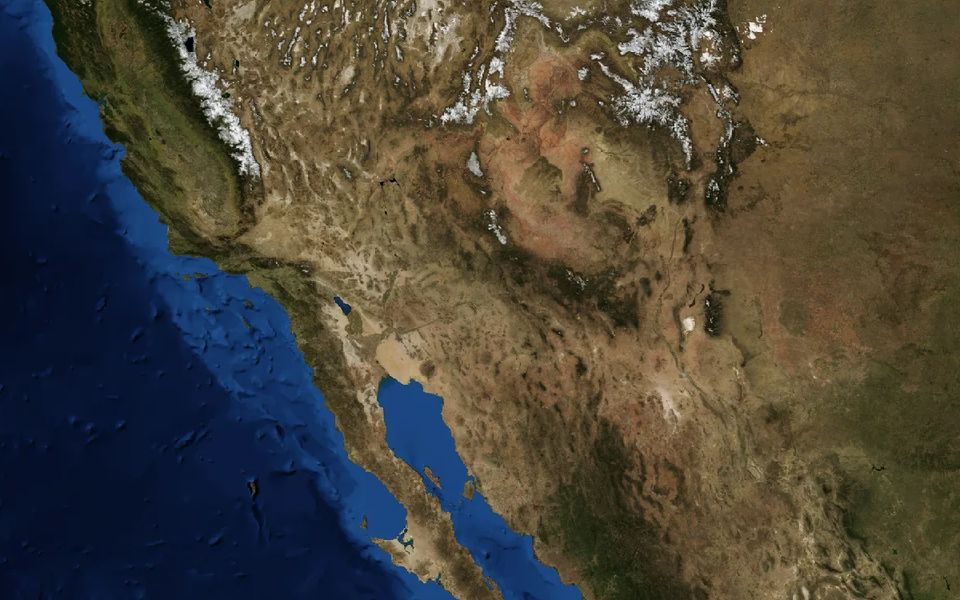
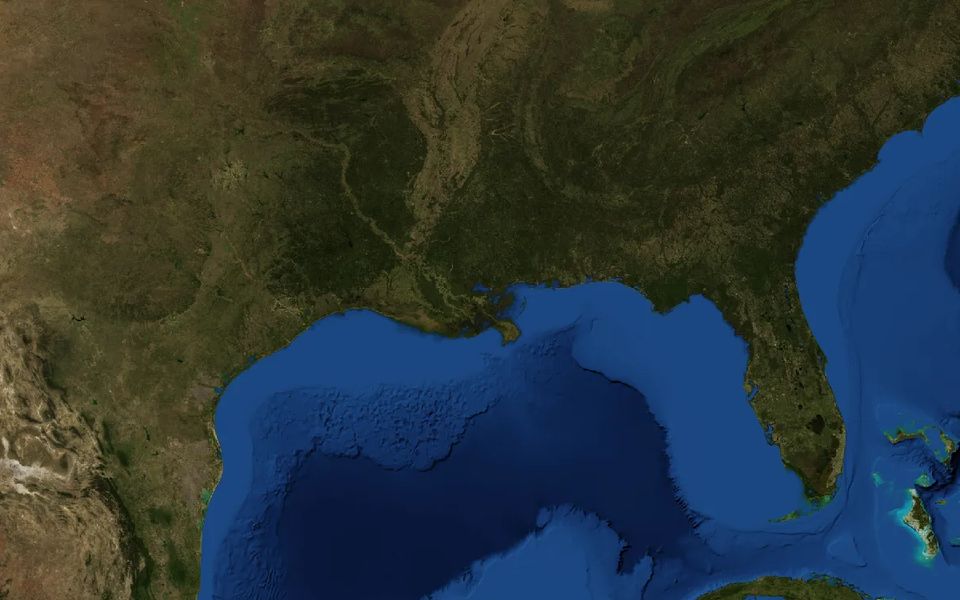
Images: NASA Earth Observatory, Blue Marble Next Generation, a November 2004 composite. They show the land around each place, not weather or current conditions.
Municipalities, housing providers, building operators and researchers use ICI to understand local conditions, share clear information with residents and plan building care.
Founding sponsors help keep ICI free. About founding sponsorship. Recognition follows a signed agreement, and no sponsor decides what ICI publishes.
Information you can check.
Every number names its source. You see the station, the years and the agency behind it.
Gaps stay gaps. If a reading does not exist, ICI says so. It never fills one in.
Not an inspection. When something needs a professional, ICI tells you.
Built on public records from Environment and Climate Change Canada, NOAA, Natural Resources Canada, the U.S. Geological Survey and NASA. ICI is independent, and these agencies do not endorse it. How ICI works