ICI Space Almanac · calculated for any place in Canada and the United States

Space Almanac

Explore how Earth moves through space, how its atmosphere changes, and what these conditions mean for the infrastructure we depend on.

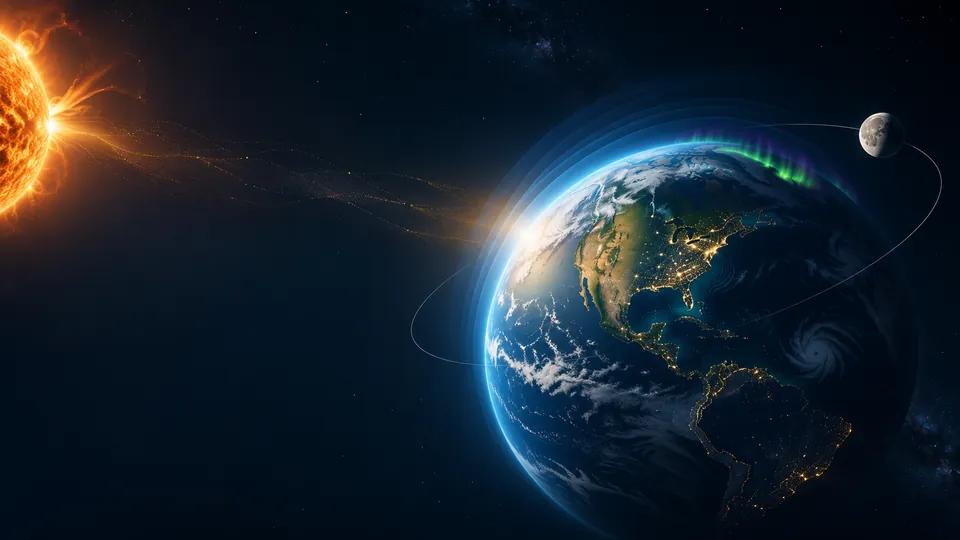
Illustration, not to scale. The Sun, Earth, Moon and aurora are drawn to explain ideas, not to show observed positions or current conditions. The motion is decorative.

Solar System Explorer

The solar system, calculated for your date

Explore any place and time

Change place and time

Choose a province, territory or state, or type a latitude and longitude, then a local date and time. Every chapter below recalculates for that moment, and the address bar keeps your choice so you can share it.

  • Astronomical calculation deterministic Sun, Moon and orbit geometry
  • Derived calculation physics or time-zone arithmetic from stated constants
  • Captured observation a stored copy of published data, not current
  • Simulated scenario a stated what-if model (clear sky), not a measurement
  • Documented report a cited published account of a past event

1 Earth in motion

Why do we have day and night?

Earth spins like a top, once every 23 hours and 56 minutes. The side facing the Sun has day. The other side has night. Clocks follow time zones, so the Sun is rarely due south at exactly 12:00 on your clock.

What it means for Earth

The spin creates the daily cycle of warming and cooling. Over long distances it also bends the paths of winds and ocean currents. Scientists call this the Coriolis effect.

Why it matters for buildings and infrastructure

Daily heating and cooling set when buildings use the most energy. Solar time, not clock time, decides when sunlight reaches each wall.

Earth turning, sped up. Its axis tilts 23.44°. Live values for your place and date are in the science section.
Explore the science clocks, solar time and the Coriolis effect for your place

Time: clocks versus the Sun

Clock time and sunlight are separate things. Universal Time (UTC) is the shared reference. Local standard time is UTC shifted by the zone's legal offset. Local civil time is what the clock shows, which includes daylight saving time where it applies. Local mean solar time follows the Sun's average position for this longitude; apparent solar time follows the real Sun, which runs up to about 16 minutes ahead or behind across the year (the equation of time).

Daylight saving time moves clock labels by one hour; it does not change astronomical daylight. Sunrise, sunset and day length below are the same whether or not a zone observes daylight saving. Arizona (outside the Navajo Nation), Saskatchewan, Yukon, Hawaii, Puerto Rico and the other territories keep one offset all year.

Earth's rotation at this latitude

What the Coriolis effect does

    What it does not do

      2 Sunlight, seasons and energy

      Why do we have seasons?

      Earth’s axis is tilted, and it keeps leaning the same way all year. In June the north half leans toward the Sun, so the Sun climbs higher and days are longer. In December it leans away. Distance is not the reason: Earth is closest to the Sun in early January.

      Explore polar night and the midnight Sun: the places where the Sun does not rise for weeks

      What it means for Earth

      Seasons change how much sunlight reaches each place. That shapes temperature, snow, growing seasons and storms.

      Why it matters for buildings and infrastructure

      The Sun’s height sets how much energy solar panels can collect. It also sets how much heat walls, roofs and windows gain in summer and lose in winter.

      DecemberNorth leans away JuneNorth leans toward the Sun September March
      Earth’s orbit seen at an angle, not to scale. The axis always leans the same way in space.
      Explore the science Earth’s orbit, the Sun at your place, day length and sunlight for solar panels

      Earth's place in its orbit

      Earth's orbit drawn to scale (eccentricity 0.0167): it is almost a circle, and the Sun sits 2.5 million km from the centre. Seen from above the North Pole; Earth moves counter-clockwise. Astronomical calculation

      Why there are seasons

      Earth's axis is tilted 23.44° from the perpendicular to its orbit and keeps pointing the same way in space all year. When the Northern Hemisphere leans toward the Sun (June solstice) the Sun climbs higher at noon and stays up longer there, so sunlight is more concentrated and lasts longer: summer. Six months later the same hemisphere leans away: winter. The Southern Hemisphere has the opposite seasons.

      Distance is not the cause. Earth is closest to the Sun in early January, in the northern winter. The roughly 3.4% swing in distance changes top-of-atmosphere sunlight by about 6.9% over the year, much less than the effect of the Sun's height in the sky.

      The Sun at this place

      Day length through the year (sunrise to sunset) Astronomical calculation
      Table view: day length and top-of-atmosphere sunlight on the 15th of each month

      Sunlight and solar panels

      The first values are top-of-atmosphere sunlight: before it passes through air, cloud, haze or smoke. They are not surface irradiance and not panel output. Satellite-based surface estimates from NASA POWER are not shown: its API refused automated retrieval by the tooling used here (robots policy, 17 Nov 2026) and its response format is not yet verified.

      Daily mean top-of-atmosphere sunlight on a horizontal surface, kWh/m² per day Derived calculation

      Clear-sky what-if at the ground (modelled)

      A simple published clear-sky model (Meinel and Meinel, with the Kasten and Young air mass, as presented by PVEducation) estimates sunlight at sea level on a cloudless, clean day. It is a scenario, not a measurement and not a forecast: any cloud, haze, smoke or snow on panels lowers it.

      Why this matters for photovoltaics: the Sun's height (cos of the zenith angle) and day length set the ceiling on how much sunlight can reach a panel; the atmosphere, weather, panel tilt and shading then decide how much does. A panel tilted toward the Sun collects more than the horizontal values here.

      Daylight and seasonal building energy demand (heating, cooling, lighting) are not estimated on this page: that needs degree-day or metered building data, which are not part of this almanac.

      3 Moon, gravity and tides

      How does the Moon move our oceans?

      The Moon’s gravity pulls on the oceans. It raises one bulge of water facing the Moon and another on the far side. As Earth turns, most coasts pass through both bulges, so they get two high tides a day. The Sun adds a smaller pull. When the Sun and Moon line up, tides are bigger. These are called spring tides.

      What it means for Earth

      Tides move huge amounts of water along coasts every day and shape coastal ecosystems.

      Why it matters for buildings and infrastructure

      High tides add to storm surge and river flooding. Ports, sea walls, drains and coastal roads are designed around official tide predictions.

      IDEALIZED TIDAL FORCING · NOT A TIDE MODEL FOR ANY COAST ← The Sun is far off this way. Its pull is about 46% of the Moon’s. Earth Moon (sped up) Bulges hugelyexaggerated Not to scale. In the open ocean the forcing bulges are less than a metre high.
      An idealized picture of the tidal forcing: the Moon’s (and, more weakly, the Sun’s) pull stretches the oceans toward and away from it. Real coasts do not simply pass under two bulges. Continents, basin shape and depth make each place’s tide semidiurnal (two similar highs a day, as on most of the U.S. and Canadian Atlantic coast), mixed (two unequal highs, as on most of the Pacific coast) or diurnal (one high a day, as in parts of the Gulf of Mexico). Local tide heights and times come from observations or official harmonic predictions (NOAA CO-OPS, Canadian Hydrographic Service), not from this drawing.
      Explore the science Moon phase and distance, and one station’s official tide record

      The Moon

      Earth–Moon distance today within its usual range Astronomical calculation

      Next principal phases

        • The Moon's phase, and the positions of the planets, do not predict local weather.
        • Lunar phase alone never indicates flooding.
        • Moonlight is far too weak for meaningful photovoltaic generation.

        Tides: what Sun–Moon geometry explains

        Ocean tides are raised mainly by the Moon, with the Sun adding a smaller tide (about 46% of the Moon's tidal force). Near new and full Moon the two line up and tidal ranges are larger: spring tides (the name has nothing to do with the season). Near first and last quarter they pull at right angles and ranges are smaller: neap tides. At many coasts the largest ranges arrive one to two days after the phase. When a new or full Moon falls near lunar perigee the range is somewhat larger again.

        The windows below are calculated from the Moon's phases and distance. They give timing only, never heights: the actual tide at any shore depends on the basin's shape and depth, and on weather, storm surge and river flow.

          Tide times and heights need official predictions for each station: NOAA CO-OPS for U.S. coasts, and the Canadian Hydrographic Service (CHS) for Canadian waters. CHS data are licence-restricted and are not shown on this page.

          4 The night sky

          What is in your sky tonight?

          This is the sky above your chosen place and time. The middle is straight overhead and the edge is the horizon, with north at the top. Tap a star, a planet or a constellation to find out what it is and where to look.

          The time you chose
          1. DaylightSun above the horizon
          2. Civil twilightSun 0° to 6° below
          3. Nautical twilight6° to 12° below
          4. Astronomical twilight12° to 18° below
          5. Nightmore than 18° below

          The background colour follows the Sun’s calculated height for this place and time (sunrise and sunset at 0.833° below the horizon, allowing for refraction and the Sun’s size). Stars, constellation lines and names stay drawn as a learning guide in daylight and twilight, when you could not see them; choose Approximate naked-eye view to hide the guides and show only what a clear, dark site would allow at that brightness. Cloud, city light, moonlight, haze and buildings or hills on your horizon are not modelled.

          Stars to magnitude 6 from the XHIP catalogue (Anderson & Francis 2012, VizieR V/137D), packaged by d3-celestial (BSD licence, © 2015 Olaf Frohn), moved from their year-2000 positions to your date. Constellation lines are a drawing convention; the International Astronomical Union defines constellations by their boundaries. Sun, Moon and planets: ICI’s validated astronomy modules. Not included: the Milky Way, moonlight, light pollution, cloud, and hills or buildings on your horizon.

          5 Solar activity and space weather

          What happens during a solar storm?

          The Sun sends out a steady stream of charged particles called the solar wind. Sometimes it throws out a much bigger burst. Earth’s magnetic field turns most of it aside, but a strong burst shakes the field. That is a geomagnetic storm. It can also push the northern lights farther south than usual.

          What it means for Earth

          Space weather does not change everyday weather or the climate. It affects the upper atmosphere and Earth’s magnetic field.

          Why it matters for buildings and infrastructure

          Strong storms can push extra current into long power lines and transformers. They can make GPS less accurate, block some radio signals and slow satellites down.

          SunEarth’s magnetic field Not to scale. Shows the idea, not today’s conditions.
          Solar wind meeting Earth’s magnetic field, not to scale.
          Explore the science NOAA space-weather values, the solar cycle and effects on technology

          Space weather

          The solar cycle, as observed

          Captured example · not current

          Monthly sunspot number, January 2019 to October 2026 Captured observation
          • monthly value
          • 13-month smoothed value (lags about six months)

          Source: NOAA SWPC observed solar cycle indices (sunspot numbers credited to S.I.D.C. Brussels / SILSO), excerpt captured 17 Nov 2026. Sunspot activity rises and falls over roughly 11 years; more sunspots go with more flares and coronal mass ejections, which drive geomagnetic storms. It indicates how active the Sun has been, not when a storm will occur.

          Captured alert headlines (observed events only)

          Captured example · not current

            How solar and geomagnetic activity affects technology

            Each card gives the physical mechanism with its source and the documented events or captured NOAA data that illustrate it. No hazard score is calculated: these are explanations, not ratings of any place or system.

            Satellite drag

            Mechanism. A geomagnetic storm puts energy into the upper atmosphere and raises its density at low-orbit altitudes, so satellites there meet more air, feel more drag and lose height faster.

            Verified event. On 4 February 2022, 38 Starlink satellites were destroyed by a geomagnetic storm; the moderate storm of 4 February led to a density enhancement of around 20–30% at around 210 km. Documented report

            Dang, T. et al. (2022), "Unveiling the space weather during the Starlink satellites destruction event on 4 February 2022", Space Weather 20(8), doi:10.1029/2022SW003152.

            Spacecraft charging

            Mechanism. Energetic electrons penetrate spacecraft components and charge builds up inside the material; when it becomes high enough a discharge or arc can occur and cause anomalous behaviour (deep-dielectric charging). NOAA issues an electron event alert when the >2 MeV electron flux exceeds 1,000 particles/(cm² s sr).

            Captured data Captured example · not current

            NOAA SWPC, GOES Electron Flux product description (swpc-drupal.woc.noaa.gov/products/goes-electron-flux, read 17 Nov 2026).

            HF radio

            Mechanism. Solar-flare X-rays ionise the lower ionosphere and enhance the D layer, which absorbs high-frequency radio waves on the sunlit side of Earth. Energetic solar protons guided by Earth's magnetic field do the same near the poles (polar cap absorption), blocking HF radio at high latitudes.

            Verified event. During 10–11 May 2024, impacts to HF radio communications occurred throughout Canada. Documented report

            NOAA SWPC, "HF Radio Communications" impacts page; Fiori, R. A. D. et al. (2025), J. Space Weather Space Clim. 15, 43, doi:10.1051/swsc/2025037.

            Satellite navigation (GPS/GNSS)

            Mechanism. Geomagnetic storms create large disturbances in the ionosphere. Receivers cannot correctly model the storm-time increase in total electron content, so position errors are introduced; near the magnetic equator, ionospheric scintillation can make receivers lose lock.

            Verified event. During 10–11 May 2024, GNSS-reliant services were affected throughout Canada, including losses of WAAS aviation approach service. Documented report

            NOAA SWPC, "Space Weather and GPS Systems"; Fiori et al. (2025).

            Power grids (geomagnetically induced currents)

            Mechanism. The storm's changing magnetic field induces a geoelectric field in the ground, driving quasi-DC currents (periods of seconds to tens of minutes) through long power lines and into transformers, which can push the transformer core into saturation.

            Verified events. On 13 March 1989 a geomagnetic storm caused a nine-hour blackout of the Hydro-Québec system, affecting 6 million people. In May 2024 (Kp 9) no Canadian power outages were reported; operators took preventive measures. Documented report

            NOAA SWPC, "Electric Power Transmission" impacts page; Fiori et al. (2025).

            What the geomagnetic storm (G) scale means

            6 Earth and infrastructure

            What does space mean for the things we build?

            Only some links between space and buildings are real. Here are the ones science supports, and one it does not.

            Explore all ten topics

            1Sunlight

            What is happening

            The Sun delivers about 1,361 watts per square metre above the atmosphere; how much reaches a roof or a window depends on the Sun’s height, the season and the air.

            Why it happens

            Earth’s round shape and tilt spread the same sunlight over more ground when the Sun is low.

            What it affects on Earth

            Daylight, warmth, plant growth and snowmelt.

            What it means for infrastructure

            Solar panel output, daylight in rooms, and solar heat on roofs and walls that cooling systems must remove.

            Practical implications

            • Orient and shade glazing for the sun’s seasonal path; low winter sun reaches deep into south-facing rooms in the northern hemisphere.
            • Size solar panels from measured or modelled local sunlight, not from a single sunny day.

            Observations and examples

            • ICI calculates the Sun’s position, sunrise, sunset and day length for any place and date in the chapter above.

            Sources: NOAA Solar Calculator method; IAU 2015 nominal solar irradiance.

            2Seasons

            What is happening

            Earth’s axis is tilted about 23.4°, so each hemisphere leans toward the Sun for half the year.

            Why it happens

            The tilt, not the distance to the Sun, makes summer and winter.

            What it affects on Earth

            Temperature, daylight, snow and the length of growing seasons.

            What it means for infrastructure

            When buildings need heating and when they need cooling; heating and cooling degree days follow the seasons.

            Practical implications

            • Service heating before the cold season and cooling before the hot season.
            • Plan exterior work for the season that suits the material: sealants and coatings have temperature limits.

            Observations and examples

            • Solstices and equinoxes are calculated for every year in the chapter above and in Your home’s story.

            Sources: Meeus, Astronomical Algorithms (seasons); NOAA and ECCC climate normals for degree days.

            3Moon and tides

            What is happening

            The Moon’s and Sun’s pull raises two tidal bulges; most coasts see two high tides a day.

            Why it happens

            Gravity weakens with distance, so the near and far sides of Earth are pulled by different amounts.

            What it affects on Earth

            Water levels on coasts and in estuaries; the largest tides come near new and full Moon.

            What it means for infrastructure

            Ports, sea walls, coastal roads and drains. A storm surge on top of a high tide is what floods coastal streets.

            Practical implications

            • Check official tide predictions, not the Moon’s phase alone, before coastal work.
            • Know when king tides (the year’s highest tides) fall where you are.

            Observations and examples

            • ICI reads official tide predictions and observations for NOAA and Canadian stations.

            Sources: NOAA CO-OPS; Canadian Hydrographic Service; Meeus ch. 47 for the Moon.

            4Solar storms

            What is happening

            Eruptions on the Sun send charged particles and magnetic fields toward Earth; geomagnetic storms follow one to three days later.

            Why it happens

            Earth’s magnetic field is shaken by the solar wind; changing fields drive currents in long conductors on the ground.

            What it affects on Earth

            Aurora, and electric currents in the ground and in long wires.

            What it means for infrastructure

            Power grids (transformer heating from geomagnetically induced currents), pipelines, GPS, radio and satellites.

            Practical implications

            • Grid and pipeline operators follow NOAA and NRCan space-weather warnings; households need no special action.
            • Keep ordinary outage preparedness; space weather is one of many causes of outages.

            Observations and examples

            • 13 March 1989: a geomagnetic storm collapsed the Hydro-Québec grid in about 90 seconds, leaving about six million people without power for about nine hours.

            Sources: NOAA Space Weather Prediction Center; Natural Resources Canada, Space Weather Canada; Hydro-Québec.

            5Earth’s spin

            What is happening

            Earth turns once a day, about 1,670 km/h at the equator.

            Why it happens

            Rotation deflects moving air (the Coriolis effect), turning large storms.

            What it affects on Earth

            Hurricanes turn counter-clockwise in the north and clockwise in the south; jet streams and trade winds follow.

            What it means for infrastructure

            Prevailing winds shape design wind loads and snow drifting; the Coriolis effect does not decide which way a sink drains.

            Practical implications

            • Use local design wind and snow loads from the building code, which already reflect prevailing weather.

            Observations and examples

            • The Earth Almanac shows modelled winds from NOAA’s GFS weather model.

            Sources: Standard atmospheric dynamics; NOAA GFS.

            6Other planets

            What is happening

            The other planets are far too distant to affect weather or buildings.

            Why it happens

            Their gravity on Earth is millions of times weaker than the Moon’s tide-raising pull.

            What it affects on Earth

            Over tens of thousands of years they slowly reshape Earth’s orbit (Milankovitch cycles), which paces ice ages.

            What it means for infrastructure

            None on human timescales. Claims that planetary alignments cause storms or earthquakes are not supported.

            Practical implications

            • Nothing to do: enjoy them in the night sky.

            Observations and examples

            • The Solar System Explorer above calculates where every planet is for any date.

            Sources: JPL approximate planetary positions (Standish); Berger and Loutre on orbital cycles.

            7Atmosphere, ozone and UV radiation

            What is happening

            Sunlight carries ultraviolet light. The ozone layer, about 15 to 35 km up, absorbs all UV-C and most UV-B; UV-A mostly passes through.

            Why it happens

            Ozone molecules absorb short-wave UV. Less atmosphere overhead (high sun, high altitude) and reflective snow mean more UV at the surface.

            What it affects on Earth

            Sunburn and skin and eye damage in people; the UV Index (World Health Organization scale) is highest near solar noon in summer, at altitude and on snow.

            What it means for infrastructure

            UV breaks chemical bonds in polymers and binders. Roofing, coatings, sealants, plastics, membranes and outdoor cables chalk, fade, crack and embrittle fastest on sun-facing surfaces. Asphalt shingles rely on mineral granules to shade the asphalt.

            Practical implications

            • Look first at south- and west-facing sealants, coatings and plastics (north-facing in the southern hemisphere): they age fastest.
            • Use materials rated for outdoor UV exposure, and respect manufacturers’ limits on how long membranes and wraps can stay uncovered during construction.
            • Loose granules in gutters can signal an ageing asphalt roof; have it assessed by a roofer from the ground or a ladder, not by walking a steep roof.
            • Check the daily UV Index for outdoor work and protect workers.

            Observations and examples

            Sources: World Health Organization, Global Solar UV Index; WMO ozone assessments; U.S. EPA and ECCC UV Index programmes.

            8Ionosphere, GPS and precise timing

            What is happening

            About 80 to 1,000 km up, sunlight and particles ionize the thin air. Navigation-satellite signals slow down and bend as they cross it.

            Why it happens

            The amount of charged gas changes by day and night, season and solar activity; geomagnetic storms make it change fast and unevenly, and it can make signals twinkle (scintillation), most often near the equator and the poles.

            What it affects on Earth

            Position errors in GPS and other navigation systems, high-frequency radio blackouts after solar flares, and degraded satellite-based augmentation.

            What it means for infrastructure

            Surveying and construction layout, aviation approaches, shipping, precision agriculture, telecommunications and power-grid timing that relies on GNSS-disciplined clocks.

            Practical implications

            • Surveyors and machine-control users: check NOAA or NRCan space-weather alerts and repeat critical measurements after a strong storm.
            • Operators of timing systems: keep holdover clocks or backup time sources.
            • Aviation and marine users follow their regulators’ notices; ordinary phone navigation usually recovers on its own.

            Observations and examples

            • During the October 2003 storms the U.S. FAA’s WAAS vertical guidance was unavailable for about 30 hours (NOAA service assessment).
            • Current geomagnetic activity (Kp) is shown in the space-weather chapter.

            Sources: NOAA SWPC (ionosphere, scintillation, R- and G-scales); NOAA Intense Space Weather Storms October 19 to November 07, 2003 service assessment; Natural Resources Canada, Space Weather Canada.

            9Satellites watching our changing Earth

            What is happening

            Weather and Earth-observation satellites image the whole planet every day: geostationary satellites every few minutes over one hemisphere, polar orbiters once or twice a day everywhere.

            Why it happens

            Each instrument measures reflected sunlight and emitted heat in chosen wavelengths, which reveal clouds, smoke, snow, ice, water and plants.

            What it affects on Earth

            Storms, wildfire smoke, snow cover, sea ice, floods, vegetation and city lights, dated to the pass.

            What it means for infrastructure

            Weather warnings that protect infrastructure, flood and fire mapping for emergency response, and records of how land around communities changes.

            Practical implications

            • Use dated images: a satellite picture shows the day it was taken, not today.
            • Clouds hide the ground in visible images; a gap is missing data, not an absence of anything.

            Observations and examples

            • ICI’s satellite viewer shows NASA GIBS daily true-colour images (MODIS and VIIRS, about 250 m) by date, and NASA EPIC whole-Earth photographs from about 1.5 million km away.

            Sources: NASA GIBS and Worldview; NASA DSCOVR EPIC; NOAA GOES.

            10Upper atmosphere and satellite orbits

            What is happening

            Above about 100 km the air is extremely thin but not empty. Satellites in low Earth orbit still brush through it and slowly lose height.

            Why it happens

            Geomagnetic storms and high solar activity heat the upper atmosphere, which expands; the air density at satellite altitudes rises and drag increases.

            What it affects on Earth

            Faster orbital decay, satellite positions that are harder to track, and earlier re-entry of debris.

            What it means for infrastructure

            Communication, navigation and Earth-observation services depend on satellites that operators must track and sometimes manoeuvre after storms.

            Practical implications

            • Satellite operators plan launches and manoeuvres around space-weather outlooks.
            • For the public: a storm can be a reason a satellite service is briefly degraded, but individual satellite problems are only known when operators report them.

            Observations and examples

            • February 2022: SpaceX reported that up to 40 of 49 newly launched Starlink satellites would re-enter after a geomagnetic storm increased drag at their low deployment altitude.
            • 1979: Skylab re-entered earlier than planned partly because solar activity was higher than planners had assumed, heating and expanding the upper atmosphere.

            Sources: NOAA SWPC; SpaceX statement (8 February 2022); NASA history of Skylab.

            See weather, oceans and land in the Earth Almanac Check a building

            7 Science and methods

            How do we know?

            Every number on this page is either calculated from a published method or copied from an official source, and it is labelled as one or the other. Here are the methods, the sources and their limits.

            Methods and sources

            Jurisdiction list and representative points come from the same 69 jurisdiction boundaries used across ICI, simplified for display; they are not legal lines. Time-zone rules inside jurisdictions that span more than one zone are approximate and can be overridden above. No location is read from your browser.