
ICI · Environmental Event Story
Rain on snow in western Maine: NOAA flood records of 18 to 22 December 2023 (reported events)
Historical NOAA records from December 2023, not current conditions.
Heavy rain fell on snow over frozen ground. The National Weather Service filed 46 of the 47 NOAA flood records of this episode with the cause Heavy Rain / Snow Melt. This page rebuilds the episode from those filed records only.
- Reported NOAA Storm Events records as filed by the National Weather Service: not rates, not probabilities
What the evidence supports. The NOAA reports describe rain falling on snow over frozen ground. A test against measured observations is held back until those observations are re-acquired (see below); nothing here is a proof of the mechanism.
What the NOAA records show
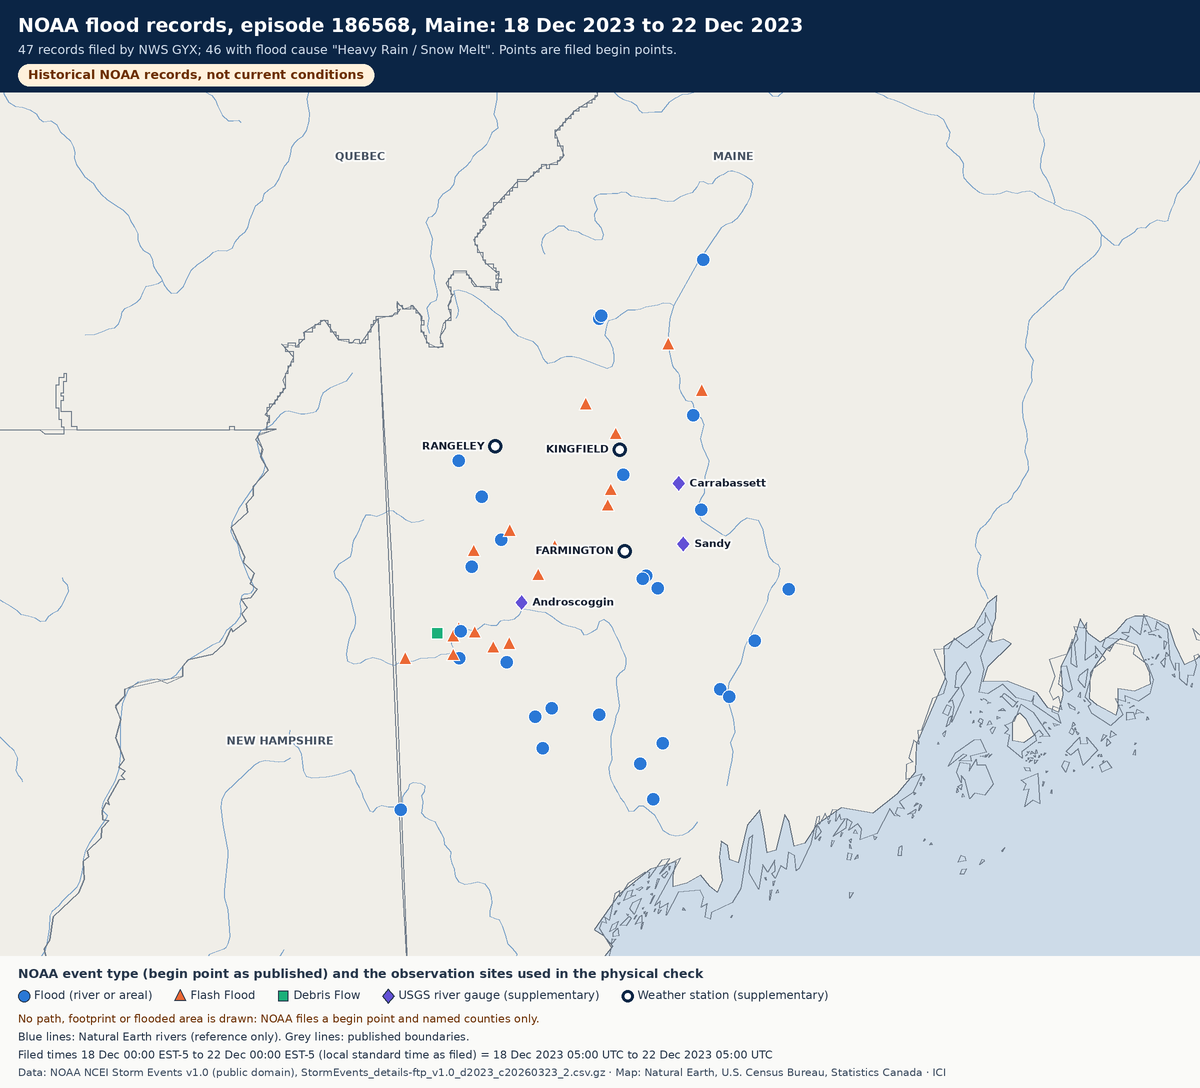
- NOAA episode 186568, filed by NWS GYX (Gray, Maine): 47 records in 5 counties (Androscoggin, Franklin, Kennebec, Oxford, Somerset), 29 Flood, 17 Flash Flood, 1 Debris Flow.
- Filed from 18 Dec 2023 05:00 UTC to 22 Dec 2023 05:00 UTC (96 hours; local standard time EST-5 as filed).
- Property damage as filed: US$28,530,000 (nominal 2023 dollars, NWS estimates; 28 records above zero). Direct deaths filed: 2.
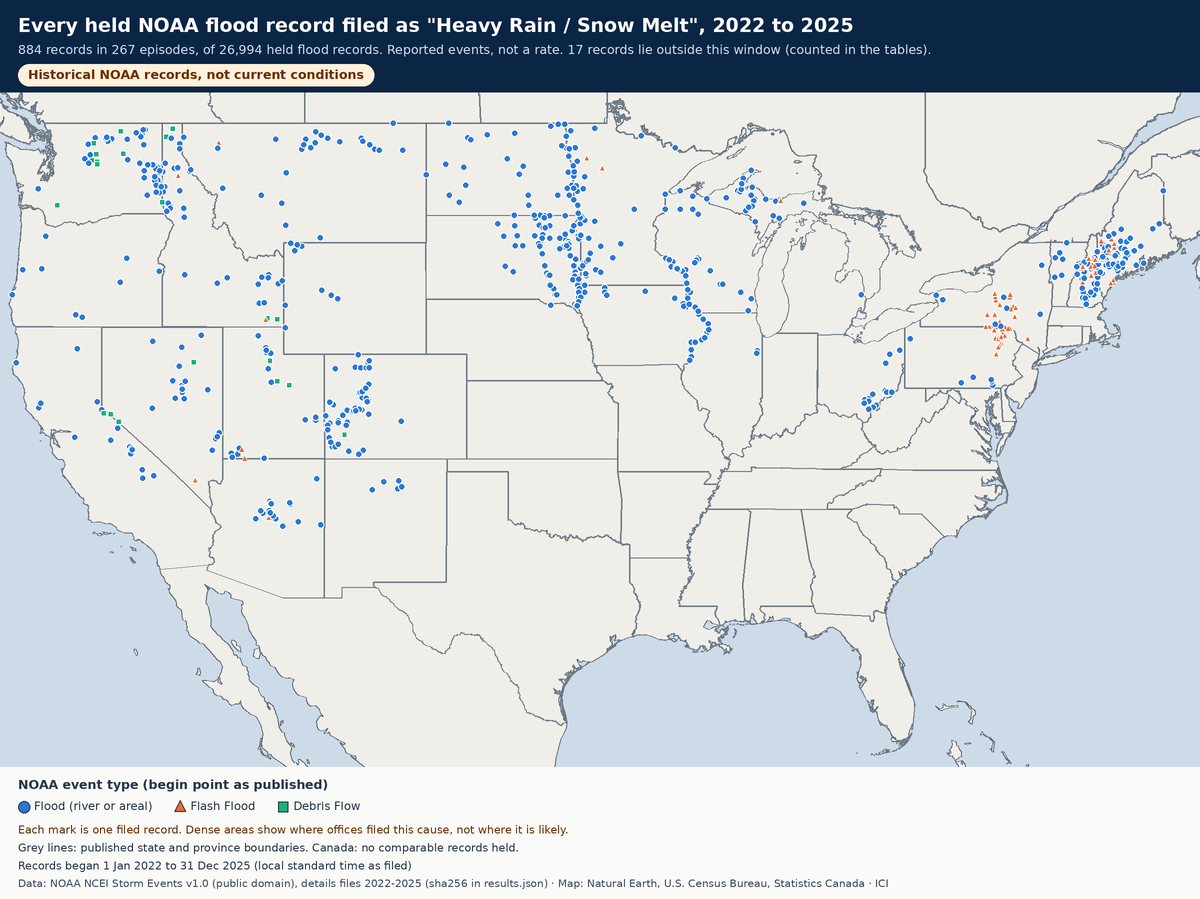
- Across 2022 to 2025, ICI holds 884 records filed with this cause, in 267 episodes (of 26,994 flood records and 6,353 flood episodes). This episode has the most such records.
Reported events only. Nothing here is a rate, a probability or a forecast.
Timeline from filed times
Each bar is one record, from its filed begin time to its filed end time. Flash floods on small streams were filed on 18 December; river floods on the Androscoggin and Kennebec were filed running into 19 to 22 December as water moved downstream.
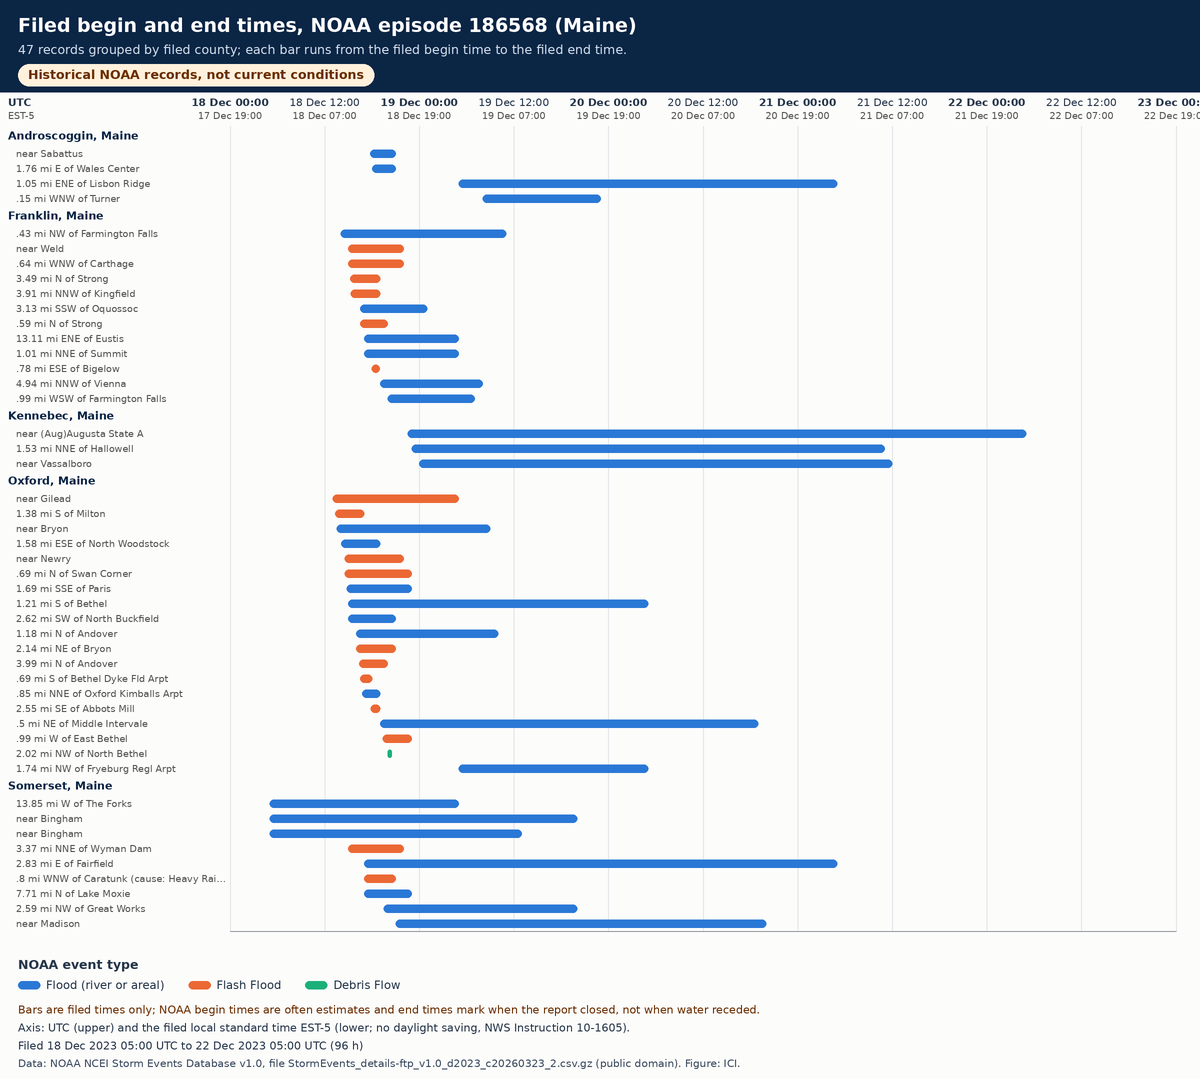
All 47 records (table view)
| NOAA event | Type | Flood cause (filed) | County / location | Began (filed, EST-5) | Ended (filed) | Property damage (filed) | Reported by |
|---|---|---|---|---|---|---|---|
| 1151027 | Flood | Heavy Rain / Snow Melt | Somerset: 13.85 mi W of The Forks | 18 Dec 00:00 | 19 Dec 00:00 | US$300,000 | Emergency Manager |
| 1152173 | Flood | Heavy Rain / Snow Melt | Somerset: near Bingham | 18 Dec 00:00 | 19 Dec 15:00 | US$100,000 | Emergency Manager |
| 1152175 | Flood | Heavy Rain / Snow Melt | Somerset: near Bingham | 18 Dec 00:00 | 19 Dec 08:00 | US$100,000 | Emergency Manager |
| 1151034 | Flash Flood | Heavy Rain / Snow Melt | Oxford: near Gilead | 18 Dec 08:00 | 19 Dec 00:00 | US$0 | NWS Storm Survey |
| 1151050 | Flash Flood | Heavy Rain / Snow Melt | Oxford: 1.38 mi S of Milton | 18 Dec 08:18 | 18 Dec 12:00 | US$0 | Department of Highways |
| 1151020 | Flood | Heavy Rain / Snow Melt | Oxford: near Bryon | 18 Dec 08:30 | 19 Dec 04:00 | US$200,000 | NWS Storm Survey |
| 1151022 | Flood | Heavy Rain / Snow Melt | Franklin: .43 mi NW of Farmington Falls | 18 Dec 09:00 | 19 Dec 06:00 | US$1,700,000 | Emergency Manager |
| 1151052 | Flood | Heavy Rain / Snow Melt | Oxford: 1.58 mi ESE of North Woodstock | 18 Dec 09:05 | 18 Dec 14:00 | US$0 | Department of Highways |
| 1151036 | Flash Flood | Heavy Rain / Snow Melt | Oxford: near Newry | 18 Dec 09:30 | 18 Dec 17:00 | US$150,000 | Emergency Manager |
| 1151037 | Flash Flood | Heavy Rain / Snow Melt | Oxford: .69 mi N of Swan Corner | 18 Dec 09:30 | 18 Dec 18:00 | US$700,000 | Emergency Manager |
| 1151060 | Flood | Heavy Rain / Snow Melt | Oxford: 1.69 mi SSE of Paris | 18 Dec 09:45 | 18 Dec 18:00 | US$0 | Department of Highways |
| 1151024 | Flood | Heavy Rain / Snow Melt | Oxford: 1.21 mi S of Bethel | 18 Dec 10:00 | 20 Dec 00:00 | US$1,750,000 | Emergency Manager |
| 1151032 | Flash Flood | Heavy Rain / Snow Melt | Somerset: 3.37 mi NNE of Wyman Dam | 18 Dec 10:00 | 18 Dec 17:00 | US$200,000 | Department of Highways |
| 1151059 | Flood | Heavy Rain / Snow Melt | Oxford: 2.62 mi SW of North Buckfield | 18 Dec 10:00 | 18 Dec 16:00 | US$20,000 | Department of Highways |
| 1151066 | Flash Flood | Heavy Rain / Snow Melt | Franklin: near Weld | 18 Dec 10:00 | 18 Dec 17:00 | US$0 | Emergency Manager |
| 1151068 | Flash Flood | Heavy Rain / Snow Melt | Franklin: .64 mi WNW of Carthage | 18 Dec 10:00 | 18 Dec 17:00 | US$0 | Emergency Manager |
| 1151065 | Flash Flood | Heavy Rain / Snow Melt | Franklin: 3.49 mi N of Strong | 18 Dec 10:12 | 18 Dec 14:00 | US$0 | Department of Highways |
| 1151067 | Flash Flood | Heavy Rain / Snow Melt | Franklin: 3.91 mi NNW of Kingfield | 18 Dec 10:18 | 18 Dec 14:00 | US$350,000 | Department of Highways |
| 1151035 | Flood | Heavy Rain / Snow Melt | Oxford: 1.18 mi N of Andover | 18 Dec 11:00 | 19 Dec 05:00 | US$100,000 | Emergency Manager |
| 1151058 | Flash Flood | Heavy Rain / Snow Melt | Oxford: 2.14 mi NE of Bryon | 18 Dec 11:00 | 18 Dec 16:00 | US$0 | Department of Highways |
| 1151057 | Flash Flood | Heavy Rain / Snow Melt | Oxford: 3.99 mi N of Andover | 18 Dec 11:20 | 18 Dec 15:00 | US$0 | Department of Highways |
| 1151054 | Flash Flood | Heavy Rain / Snow Melt | Oxford: .69 mi S of Bethel Dyke Fld Arpt | 18 Dec 11:30 | 18 Dec 13:00 | US$0 | Fire Department/Rescue |
| 1151064 | Flood | Heavy Rain / Snow Melt | Franklin: 3.13 mi SSW of Oquossoc | 18 Dec 11:30 | 18 Dec 20:00 | US$0 | Emergency Manager |
| 1152105 | Flash Flood | Heavy Rain / Snow Melt | Franklin: .59 mi N of Strong | 18 Dec 11:30 | 18 Dec 15:00 | US$50,000 | Department of Highways |
| 1151053 | Flood | Heavy Rain / Snow Melt | Oxford: .85 mi NNE of Oxford Kimballs Arpt | 18 Dec 11:44 | 18 Dec 14:00 | US$10,000 | Department of Highways |
| 1151026 | Flood | Heavy Rain / Snow Melt | Somerset: 2.83 mi E of Fairfield | 18 Dec 12:00 | 21 Dec 00:00 | US$10,000,000 | Emergency Manager |
| 1151033 | Flood | Heavy Rain / Snow Melt | Franklin: 13.11 mi ENE of Eustis | 18 Dec 12:00 | 19 Dec 00:00 | US$0 | Emergency Manager |
| 1151061 | Flash Flood | Heavy Rain | Somerset: .8 mi WNW of Caratunk | 18 Dec 12:00 | 18 Dec 16:00 | US$350,000 | Emergency Manager |
| 1151062 | Flood | Heavy Rain / Snow Melt | Somerset: 7.71 mi N of Lake Moxie | 18 Dec 12:00 | 18 Dec 18:00 | US$0 | Emergency Manager |
| 1151063 | Flood | Heavy Rain / Snow Melt | Franklin: 1.01 mi NNE of Summit | 18 Dec 12:00 | 19 Dec 00:00 | US$0 | Emergency Manager |
| 1152179 | Flood | Heavy Rain / Snow Melt | Androscoggin: near Sabattus | 18 Dec 12:45 | 18 Dec 16:00 | US$0 | County Official |
| 1151051 | Flash Flood | Heavy Rain / Snow Melt | Oxford: 2.55 mi SE of Abbots Mill | 18 Dec 12:49 | 18 Dec 14:00 | US$50,000 | Department of Highways |
| 1151069 | Flash Flood | Heavy Rain / Snow Melt | Franklin: .78 mi ESE of Bigelow | 18 Dec 13:00 | 18 Dec 14:00 | US$200,000 | Emergency Manager |
| 1152180 | Flood | Heavy Rain / Snow Melt | Androscoggin: 1.76 mi E of Wales Center | 18 Dec 13:00 | 18 Dec 16:00 | US$0 | County Official |
| 1151025 | Flood | Heavy Rain / Snow Melt | Oxford: .5 mi NE of Middle Intervale | 18 Dec 14:00 | 20 Dec 14:00 | US$5,000,000 | Emergency Manager |
| 1152096 | Flood | Heavy Rain / Snow Melt | Franklin: 4.94 mi NNW of Vienna | 18 Dec 14:00 | 19 Dec 03:00 | US$10,000 | Emergency Manager |
| 1151055 | Flash Flood | Heavy Rain / Snow Melt | Oxford: .99 mi W of East Bethel | 18 Dec 14:20 | 18 Dec 18:00 | US$0 | Department of Highways |
| 1151021 | Flood | Heavy Rain / Snow Melt | Somerset: 2.59 mi NW of Great Works | 18 Dec 14:30 | 19 Dec 15:00 | US$5,000,000 | Emergency Manager |
| 1151056 | Debris Flow | Heavy Rain / Snow Melt | Oxford: 2.02 mi NW of North Bethel | 18 Dec 15:00 | 18 Dec 15:30 | US$350,000 | Broadcast Media |
| 1152139 | Flood | Heavy Rain / Snow Melt | Franklin: .99 mi WSW of Farmington Falls | 18 Dec 15:00 | 19 Dec 02:00 | US$500,000 | Emergency Manager |
| 1151028 | Flood | Heavy Rain / Snow Melt | Somerset: near Madison | 18 Dec 16:00 | 20 Dec 15:00 | US$230,000 | Emergency Manager |
| 1151030 | Flood | Heavy Rain / Snow Melt | Kennebec: near (Aug)Augusta State A | 18 Dec 17:30 | 22 Dec 00:00 | US$100,000 | Emergency Manager |
| 1151031 | Flood | Heavy Rain / Snow Melt | Kennebec: 1.53 mi NNE of Hallowell | 18 Dec 18:00 | 21 Dec 06:00 | US$250,000 | Emergency Manager |
| 1151029 | Flood | Heavy Rain / Snow Melt | Kennebec: near Vassalboro | 18 Dec 19:00 | 21 Dec 07:00 | US$200,000 | Emergency Manager |
| 1151023 | Flood | Heavy Rain / Snow Melt | Oxford: 1.74 mi NW of Fryeburg Regl Arpt | 19 Dec 00:00 | 20 Dec 00:00 | US$0 | Emergency Manager |
| 1152177 | Flood | Heavy Rain / Snow Melt | Androscoggin: 1.05 mi ENE of Lisbon Ridge | 19 Dec 00:00 | 21 Dec 00:00 | US$560,000 | Emergency Manager |
| 1152176 | Flood | Heavy Rain / Snow Melt | Androscoggin: .15 mi WNW of Turner | 19 Dec 03:00 | 19 Dec 18:00 | US$0 | Emergency Manager |
The physical mechanism
Snowmelt flooding happens when melting snow is a major source of the water. Rain falling on snow adds water and helps melt the snowpack, and frozen ground stops that water soaking in, so more of it runs off into streams at once (NWS; NWS Training Center). NOAA's episode narrative describes this sequence for December 2023:
Strong high pressure over the North Atlantic created a deep southeasterly flow that drew warm air into New England ahead of the approaching storm. … By the time precipitation arrived on the evening of the 17th, temperatures were warm enough for rain everywhere except the highest peaks. … The anomalously warm air mass also led to intense rainfall rates beginning on the evening of the 17th, which continued into the 18th. … Even as the center of the storm remained near Chesapeake Bay on the morning of the 18th, a strong low level jet had developed and winds began to gust in excess of 50 mph well inland from the coast. … Damaging wind gusts continued into the afternoon. … Hundreds of thousands of customers lost power due to falling limbs and downed wires. … This fell on top of snow that was ripe from previous rainfall about a week earlier. … An additional 2 to 3 inches of snow water equivalent was likely added to rainfall runoff. … The storm destroyed 13 homes, caused major damage to 106 others, with an additional 65 homes receiving minor flood damage. … Private damage was in the millions with public infrastructure damage of 20+ million being reported by FEMA.
NOAA episode narrative, in NOAA's words (excerpts, unchanged). The U.S. Geological Survey's alert of 18 December 2023 independently reported "a widespread 2 to 4.5 inches of rain, on top of a frozen ground with a ripe snowpack in the mountains/headwaters" in Maine.
- Verified 2026-11-17 NOAA National Weather Service, Flood Safety: Flood Hazards: Snowmelt flooding occurs when the major source of water is melting snow; "Rain falling while snow is still on the ground contributes more water for flooding and helps to melt the snowpack"; "Deep, hard ground frost prevents snowmelt from infiltrating into the soil"; high soil moisture before melt contributes. Ice jams are a separate winter/spring river hazard.
- Verified 2026-11-17 NOAA NWS Training Center, Hydrology: flooding fact sheet: "A flood is considered a snowmelt flood when melting snow is a major source of the water involved"; listed contributors include high soil moisture before melt, frozen ground, heavy snow cover and widespread heavy rain during the melt period. The sheet does not use the words "rain on snow" or "ripe snowpack".
- Verified 2026-11-17 U.S. Geological Survey, Water Resources alert, 18 Dec 2023 (Maine): Independent of NOAA Storm Events, for the chosen episode: "A widespread 2 to 4.5 inches of rain, on top of a frozen ground with a ripe snowpack in the mountains/headwaters" across western, central and southern Maine; five sites in the Kennebec and Androscoggin basins met or exceeded previously computed 1 or 2% AEP flows. ICI holds none of the USGS gauge data behind this alert.
- Verified 2026-11-17 NOAA NCEI, Storm Data Export Format: FLOOD_CAUSE: "Reported or estimated cause of the flood"; EPISODE_ID: assigned by NWS to denote the storm episode; DAMAGE_PROPERTY: "The estimated amount of damage to property"; CZ_TYPE C/Z/M; EPISODE_NARRATIVE is created by NWS.
- Verified 2026-11-17 NWS Instruction 10-1605, Storm Data Preparation: Section 2.9.3: the cause or trigger for Flood, Flash Flood and Debris Flow events is entered from a list in the Storm Data software. Table 1: High Wind and Winter Storm are entered by zone (Z), Flood by county (C). Section 1: outside-source information may be unverified by the NWS. The exact cause-list wording ("Heavy Rain / Snow Melt") was NOT found in the part read; it is taken from the held NOAA records.
- Not verified not verified: The wind part of this storm (a strong low-level jet, gusts above 50 mph) is described only in NOAA's episode narrative. ICI has NOT verified a separate NWS/NOAA mechanism page for it in this slice, and holds no wind records for the episode.
Testing the mechanism with observations
Held back from this public page. A check of the mechanism against station and river observations exists, but those values were transcribed by a fetch tool rather than downloaded byte for byte, and they are not yet custody-registered. They will be published, labelled as observations, once they have been re-acquired with a checksummed download and match the source. Until then this page rests on the NOAA reported events alone.
What was measured, and what is missing
Observed measurements in custody for this episode: none. Everything else on this page is a count or sum of filed NOAA fields, a quote, or a station normal shown as context.
| Quantity | Held? | What exists instead |
|---|---|---|
| Basin-average rainfall | Missing (not measured) | Only three point gauges were acquired (supplementary GHCN-Daily); no radar/gauge analysis (Stage IV, MRMS) is held. NOAA narratives give estimates in words. |
| Snow water equivalent of the snowpack before the rain | Missing (not measured) | WESD was requested from GHCN-Daily and returned blank at all three stations; no SNOTEL, snow-survey or SNODAS data held. The episode narrative says 2 to 3 inches was "likely" added (NOAA's words). |
| Soil frost / frozen-ground depth | Missing (not measured) | No soil-frost data held or acquired; frozen ground appears only in NOAA and USGS text. |
| Air temperature at Kingfield | Missing (not reported) | The Kingfield GHCN-Daily record returned no TMAX/TMIN for these dates. |
| Instantaneous peak discharge and stage | Missing (not measured) | Only USGS daily mean discharge was acquired; daily means are lower than the instantaneous peaks. Crest heights appear only in NOAA narrative text. |
| Measured wind gust | Missing (not reported) | No wind record held for this episode: High Wind is a zone-filed NOAA type, held only as yearly zone counts. The episode narrative mentions gusts above 50 mph. |
| Ice accretion | Missing (not applicable) | Not part of this case (a rain event); no ice-accretion data held for any case. |
| Customers without power | Missing (not measured) | No utility outage data held; the episode narrative mentions hundreds of thousands of customers (NOAA's words). |
Station normals near the records (context only)
Nearest published station (within 50 km) to each qualifying record: days with snow on the ground in a typical year, 1991-2020. A normal says nothing about snow on the ground in December 2023.
- BRIDGTON 3 NW, ME US: 121.3 days (6 records, 24.8 to 43 km away)
- DURHAM, ME US: 107 days (3 records, 4.6 to 30.6 km away)
- EUSTIS, ME US: 153.6 days (2 records, 20.2 to 21.2 km away)
- FARMINGTON, ME US: 112.2 days (3 records, 14.2 to 26.8 km away)
- GARDINER, ME US: 90.8 days (4 records, 9 to 27.2 km away)
- KINGFIELD, ME US: 121.5 days (7 records, 4.6 to 29.5 km away)
- MOOSEHEAD, ME US: 143 days (1 records, 17.8 to 17.8 km away)
- NEW SHARON, ME US: 117.9 days (5 records, 5.7 to 36.6 km away)
- RANGELEY, ME US: 143.6 days (6 records, 11.6 to 36.3 km away)
- BERLIN, NH US: 114.6 days (8 records, 17.4 to 37 km away)
- N CONWAY, NH US: 113.3 days (1 records, 12.5 to 12.5 km away)
What NOAA documented
Filed fields and NOAA narrative text, counted; ICI has not verified them.
- Property damage: US$28,530,000 summed over 47 filed values (0 blank). Crop damage: US$0.
- Deaths: 2 direct, 0 indirect. Injuries: 0 direct, 0 indirect.
- Of 47 event narratives: 44 mention roads, bridges, culverts or washouts; 14 mention a river crest; 7 mention a rescue; 14 mention homes or houses; 7 mention frozen ground; 40 mention snowmelt.
- Filing note: event 1151061 is filed with the cause "Heavy Rain", yet its narrative reads: "Heavy rain and snowmelt caused the Pleasant Pond Stream to flood 2 bridges, one near Main Street and the other upstream. Main Street was closed cutting off most homes in the community. Some buildings were also inundated."
River crests quoted in NOAA narratives (15 sentences)
- 1151020: "Record flooding occurred along the Swift River in Roxbury with a river crest at 14.2 feet, breaking the record of 12.87 feet set in October of 1959."
- 1151021: "This was the second highest crest ever recorded since the gage was established in 1929."
- 1151023: "The stream height reached 17.72 on the evening of the 18th, exceeding the record held by Irene in 2011 which crested at 17.23 feet with a flow of 58.2 kcfs."
- 1151025: "The river rose 17��� in roughly 12 hours, cresting at 22.1 feet."
- 1151028: "The USGS river gage at Madison surpassed the flood of 1987 cresting at 26.7 feet."
- 1151029: "The USGS river gage in North Sidney crested at 32.32 feet."
- 1151029: "This is the second highest flood since the gage was established in 1979, surpassed only by the flood of 1987 which crested at 39.31 feet."
- 1151030: "On December 19th the Kennebec River at Augusta reached the 3rd highest level on record, cresting at 26.92 feet."
- 1151031: "On December 19th, the Kennebec River at Hallowell reached major flood stage, cresting at 22.5 feet at the USGS river gage."
- 1151033: "The river crested at 11.4 feet during the early morning of December 19th."
- 1151034: "Major flooding occurred on the Wild River in Gilead with the USGS river gage marked the 2nd highest crest on record of 16.4 feet."
- 1151035: "The river reached major flood stage cresting at 21.5 feet with a flow of 15,800 cfs, surpassing the previous flood of record of 19.26 feet set in December of 2003."
- 1152139: "The river crested at a stage of 17.35 feet which was the 3rd highest crest ever recorded."
- 1152173: "The USGS river gage at Madison surpassed the flood of 1987 cresting at 26.7 feet."
- 1152176: "The Nezinscot River in Turner reached moderate flood stage on December 19th, cresting at 8.7 feet at the USGS river gage."
NOAA's words. ICI holds no gauge data, so these heights are quoted, not verified.
How this compares with other held records, 2022 to 2025
Compared only with other held NOAA records of 2022-2025: counts of records and episodes filed with the same cause, by year, season, region and jurisdiction, each with its denominator. These are reported events, not rates or probabilities; four years are too short for climatology.
| Season (begin month) | Records filed "Heavy Rain / Snow Melt" of all flood records | Episodes of all flood episodes |
|---|---|---|
| DJF | 275 of 4,765 | 52 of 735 |
| MAM | 547 of 7,136 | 182 of 1,522 |
| JJA | 56 of 11,702 | 29 of 3,305 |
| SON | 6 of 3,391 | 4 of 791 |
| Region (U.S. Census) | Records | Episodes | Dec-Feb | Mar-May | Jun-Aug | Sep-Nov |
|---|---|---|---|---|---|---|
| Northeast | 202 of 3,341 | 24 of 611 | 17 of 66 | 7 of 97 | 0 of 370 | 0 of 78 |
| Midwest | 366 of 5,219 | 103 of 1,406 | 11 of 100 | 83 of 433 | 6 of 793 | 3 of 80 |
| South | 0 of 11,578 | 0 of 2,665 | 0 of 334 | 0 of 699 | 0 of 1283 | 0 of 349 |
| West | 316 of 5,520 | 140 of 1,497 | 24 of 207 | 92 of 250 | 23 of 815 | 1 of 225 |
| Territories | 0 of 1,336 | 0 of 174 | 0 of 28 | 0 of 43 | 0 of 44 | 0 of 59 |
| Year | Records | Episodes |
|---|---|---|
| 2022 | 106 of 5,237 | 39 of 1,512 |
| 2023 | 656 of 6,636 | 182 of 1,620 |
| 2024 | 57 of 7,304 | 21 of 1,532 |
| 2025 | 65 of 7,817 | 25 of 1,689 |
Episodes are counted in the season of their earliest record and in every region holding one of their records. 8 of 267 qualifying episodes also hold a thunderstorm or marine wind record; zone-filed High Wind records are not held per record, so wind in storms like this one cannot be counted.
Every jurisdiction
All 56 U.S. jurisdictions are listed: 25 hold records filed with this cause; the rest are stated as holding none. Canada's 13 provinces and territories: no records held: NOAA Storm Events does not cover Canada, and the held NRCan Historical Flood Events derivative keeps cause counts for its whole period and only the six most recent events per province or territory, with no combined rain-and-snowmelt cause, so 2022-2025 cannot be enumerated.
- 0 Alabama no records held with this filed cause
- 17 Alaska of 128 flood records
- 20 Arizona of 1,000 flood records
- 0 Arkansas no records held with this filed cause
- 19 California of 2,530 flood records
- 53 Colorado of 400 flood records
- 0 Connecticut no records held with this filed cause
- 0 Delaware no records held with this filed cause
- 0 District of Columbia no records held with this filed cause
- 0 Florida no records held with this filed cause
- 0 Georgia no records held with this filed cause
- 0 Hawaii no records held with this filed cause
- 37 Idaho of 111 flood records
- 12 Illinois of 652 flood records
- 0 Indiana no records held with this filed cause
- 33 Iowa of 441 flood records
- 0 Kansas no records held with this filed cause
- 0 Kentucky no records held with this filed cause
- 0 Louisiana no records held with this filed cause
- 85 Maine of 289 flood records
- 0 Maryland no records held with this filed cause
- 0 Massachusetts no records held with this filed cause
- 27 Michigan of 84 flood records
- 70 Minnesota of 300 flood records
- 0 Mississippi no records held with this filed cause
- 0 Missouri no records held with this filed cause
- 31 Montana of 112 flood records
- 0 Nebraska no records held with this filed cause
- 30 Nevada of 181 flood records
- 55 New Hampshire of 221 flood records
- 0 New Jersey no records held with this filed cause
- 6 New Mexico of 413 flood records
- 26 New York of 951 flood records
- 0 North Carolina no records held with this filed cause
- 45 North Dakota of 78 flood records
- 17 Ohio of 888 flood records
- 0 Oklahoma no records held with this filed cause
- 13 Oregon of 80 flood records
- 28 Pennsylvania of 953 flood records
- 0 Rhode Island no records held with this filed cause
- 0 South Carolina no records held with this filed cause
- 121 South Dakota of 452 flood records
- 0 Tennessee no records held with this filed cause
- 0 Texas no records held with this filed cause
- 25 Utah of 296 flood records
- 8 Vermont of 135 flood records
- 0 Virginia no records held with this filed cause
- 52 Washington of 118 flood records
- 0 West Virginia no records held with this filed cause
- 41 Wisconsin of 260 flood records
- 13 Wyoming of 66 flood records
- 0 American Samoa no records held with this filed cause
- 0 Guam no records held with this filed cause
- 0 Northern Mariana Islands no records held
- 0 Puerto Rico no records held with this filed cause
- 0 Virgin Islands no records held with this filed cause
Canada
- 0 Alberta no records held
- 0 British Columbia no records held
- 0 Manitoba no records held
- 0 New Brunswick no records held
- 0 Newfoundland and Labrador no records held
- 0 Nova Scotia no records held
- 0 Ontario no records held
- 0 Prince Edward Island no records held
- 0 Quebec no records held
- 0 Saskatchewan no records held
- 0 Northwest Territories no records held
- 0 Nunavut no records held
- 0 Yukon no records held
Infrastructure: general possibilities
ICI's general interpretation, separate from what NOAA documented above. These are possibilities for this kind of compound flood, not findings about any place or building.
- Home
- Where heavy rain falls on snow over frozen ground, more water can run off at once: basements, foundation drainage, sump pumps and low driveways may see water they do not see in rain alone, and road washouts can cut access.
- Commercial
- Low-lying parking, loading docks and below-grade rooms near small streams could flood quickly; roof drains and snow-covered roofs may hold extra water if drains are frozen.
- Industrial
- Sites beside rivers that rise for a day or more after the rain can face access loss, stored-material and chemical-containment concerns, and process water intakes may be affected where debris and sediment arrive with the flood.
- Solar
- Ground-mounted arrays in floodplains may be exposed to flowing water and debris; landslides on saturated, thawing slopes could affect access roads and racking foundations.
- Wind
- Strong winds sometimes come with the same storm; turbines and access roads on thawing slopes may need checks for washouts, and collection lines can be exposed where streams overtop.
- Water
- Culverts, bridges and stormwater systems sized for rain alone can be overwhelmed when snowmelt adds water; treatment plants near rivers may see inflow and flooding risks during multi-day river crests.
- Coastal
- Where rivers carrying rain and snowmelt reach tidal water, high tide may slow drainage; this case holds no coastal water-level data, so no coastal effect is shown.
- Transportation
- Washouts of roads, culverts and bridge approaches can isolate communities on small streams within hours, and river crossings may close for days while larger rivers crest downstream.
Why this case
Held at record level for every year: 884 point records with begin/end times, filed zone, county, reporting source, damage fields and NOAA narratives, in 267 episodes. The compound (rain + snowmelt) is named by the filing NWS office in FLOOD_CAUSE, so nothing is inferred. The episode was picked by a fixed rule: the qualifying episode with the most qualifying records in the held 2022-2025 point records; ties broken by larger total filed property damage, then by the smaller episode key.
- Winter storm or ice with high wind: rejected. Winter Storm, Ice Storm, Sleet, High Wind and Strong Wind are zone-filed NOAA types. ICI holds them only as yearly counts per zone (areas-YYYY.json, groups winter/wind), with no episode id, begin/end time or narrative, so no co-occurrence in one episode can be shown. No ice-accretion or gust observations are held either.
- Rain on snow from station normals: The held station evidence is 1991-2020 normals (days with snow on the ground in a typical year) and summary QC files (ghcn-2025-validation.json, ghcn-coverage.json: counts only, no dated daily snow depth). A normal cannot show snow on the ground on a flood date, so a proxy built on it would not be evidence. NOAA records instead carry the NWS-filed FLOOD_CAUSE "Heavy Rain / Snow Melt", which names the compound directly; that is the chosen case.
- Coastal flood with marine wind: rejected. Coastal Flood and Storm Surge/Tide are zone-filed and not held per record. Marine High/Strong Wind records are held as points, but none of their episodes holds a held flood record (marine and land episodes are filed separately), so the co-occurrence cannot be shown from held records.
- Heat with overnight temperatures: rejected. Heat and Excessive Heat are zone-filed (yearly zone counts only), and no dated overnight temperature observations are held (only 1991-2020 normals).
Reporting bias, completeness and limits
- Counts of NOAA Storm Events records and episodes as filed. They are reported events: not rates, not probabilities, not a frequency at any place and not a measure of risk to any property.
- The compound is identified only by NOAA's FLOOD_CAUSE field ("reported or estimated cause"). It is chosen by the filing NWS office from a software list; offices code it differently, and a record whose narrative describes snowmelt may carry the cause "Heavy Rain" (counted below). Counts therefore reflect filing practice as well as weather.
- ICI holds no rainfall, snow-water-equivalent, snow-depth, soil-frost, temperature, river-stage, discharge or wind measurements for 2022-2025 events. Numbers in NOAA narratives (inches of rain, crest heights) are NOAA's words, quoted, not held data.
- Each record is mapped at its published begin point (3 decimals). End locations are filed as text only. Filed areas are named counties; no county polygons are held, so no area is drawn and no footprint, path or flooded extent is shown.
- Four years (2022-2025) are too short for climatological conclusions; year-to-year counts vary widely (one December 2023 storm system dominates 2023).
- Zone-filed NOAA types (High Wind, Winter Storm, Heavy Snow, Coastal Flood, Heat) are held only as yearly counts per zone, without episode, time or narrative, so they cannot be linked to these episodes.
- United States and territories (NOAA). Canada: no comparable records are held (see the jurisdiction table).
- Station snow-cover normals (1991-2020) describe a typical year at a station; they are context only and say nothing about snow on the ground on the dates of these floods.
- Damage values are NWS estimates as recorded in NOAA Storm Events, nominal U.S. dollars for the year of the event, preliminary and revisable (file version stated). A blank is "not given", never zero.
Filing practice: 48 of 123 NWS offices that filed flood records used this cause at least once; 37 flood records filed with another cause mention snowmelt in their narrative.
Source and custody
- Source file
StormEvents_details-ftp_v1.0_d2023_c20260323_2.csv.gz- Source sha256
713784bed40d9e5a95b1d6240a654f865f3ef97703713105c7b35437270da134- Held derivatives
- 842 ICI derivative files (digest of path + sha256 list)
- Derivatives digest
5e042c7de8cc11d941a3d7414517e260995b0a38368f8c0d0cb8c0f8d43a0b8a- Story record
story.json(contractici-event-story/1), built byscripts/science/compound_rain_snowmelt_flood.mjs
NOAA National Centers for Environmental Information, Storm Events Database v1.0 (U.S. Government work, public domain). Station normals: NOAA NCEI U.S. Climate Normals 1991-2020. Map: Natural Earth; U.S. Census Bureau; Statistics Canada. Analysis and figures: ICI (internal).